Dashboard Overview
- 09 Aug 2024
- 3 Minutes to read
- Print
- DarkLight
Dashboard Overview
- Updated on 09 Aug 2024
- 3 Minutes to read
- Print
- DarkLight
Article summary
Did you find this summary helpful?
Thank you for your feedback
The school Dashboard is an essential part of tracking enrollment goals, pipeline, and your recruitment and enrollment effectiveness.
Schola believes that all efforts should be measurable, data-driven and catered to your school’s specific needs. This information will help you understand your school’s landscape and goals, track your enrollment progress, and personalize your overall Schola experience.
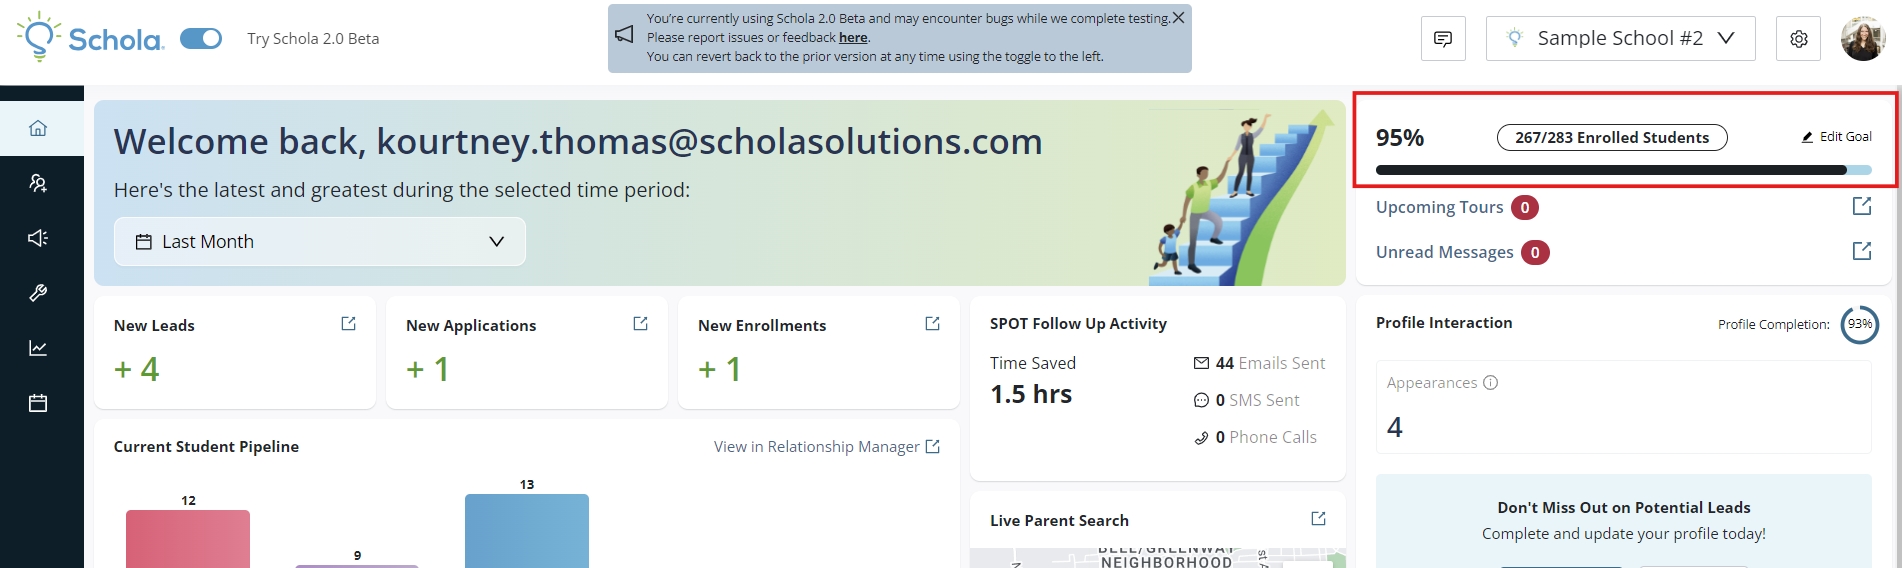
Upon logging into your Schola Admin account, you will land on the Dashboard.
In the top left-hand corner, you will see the email associated with the Schola account, and an option to select a timeline for your Dashboard data. This will default to "Since Last Login."
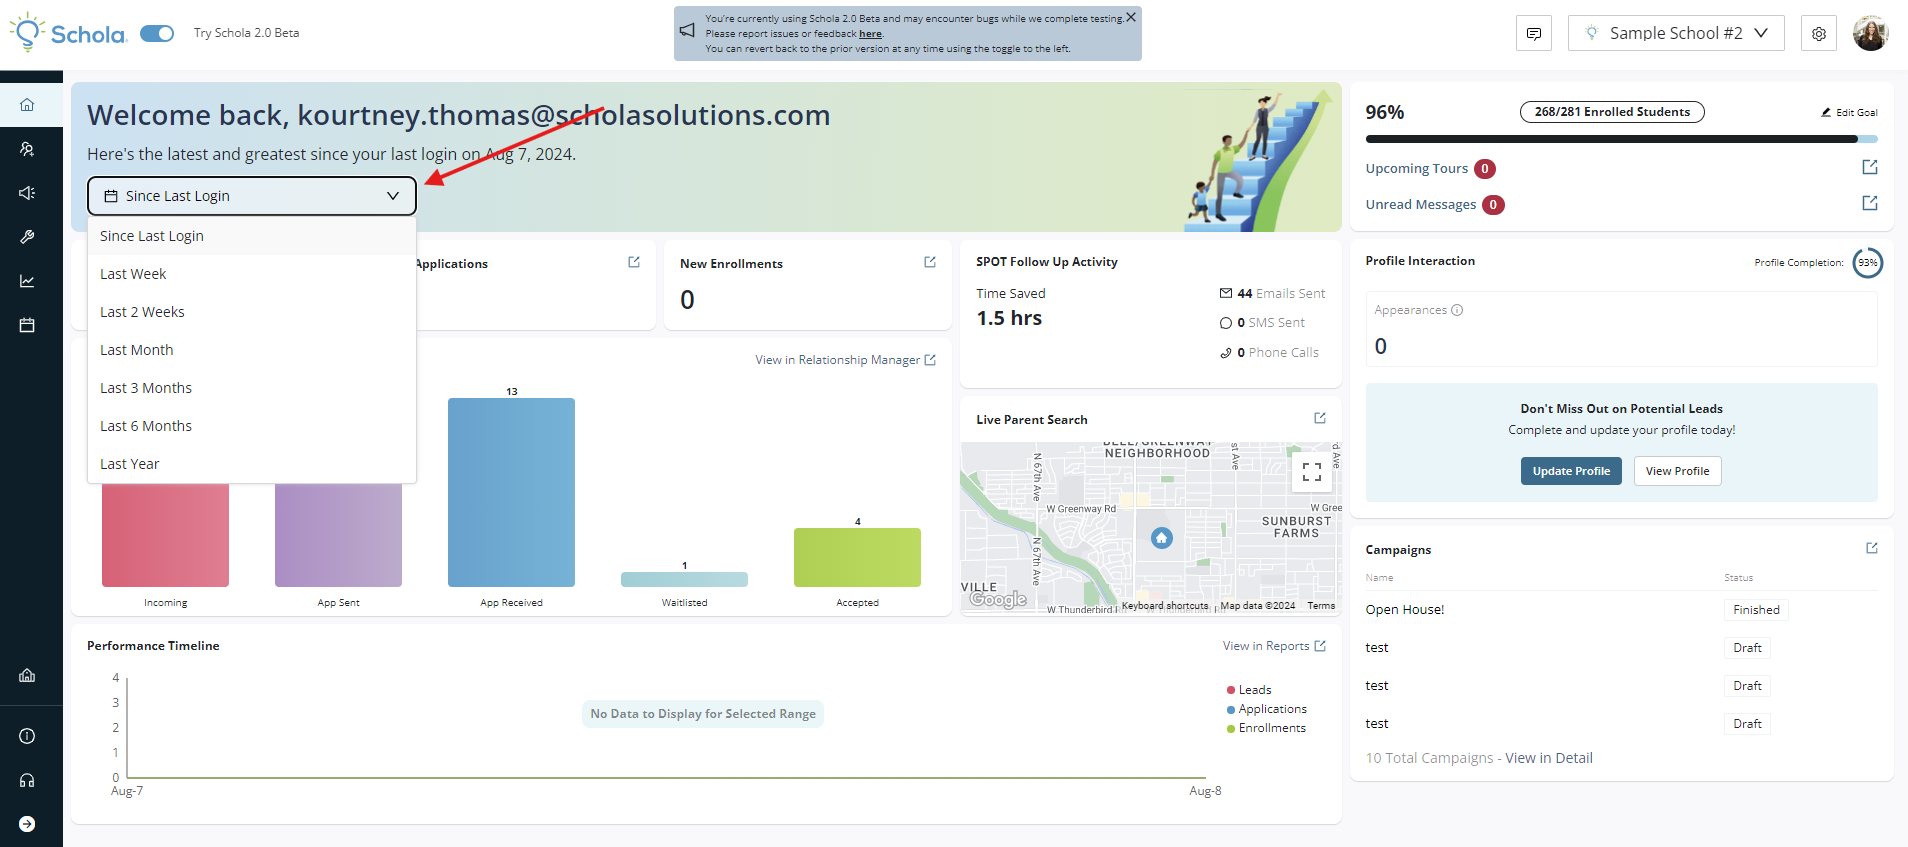
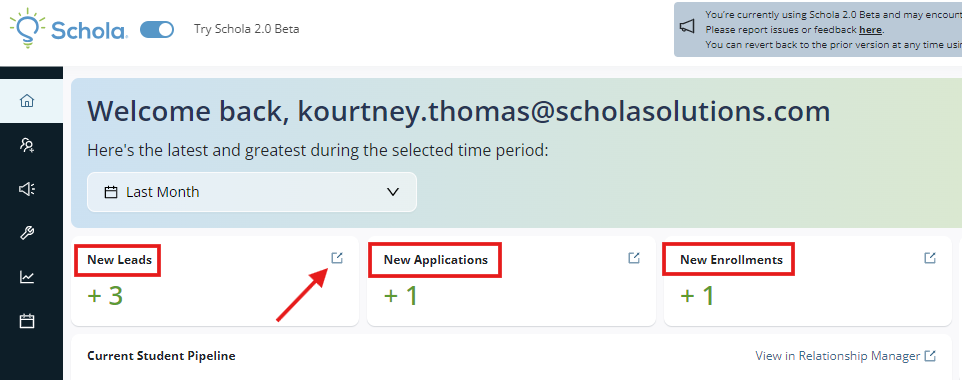
Once you select your desired timeline, you will see the amount of New Leads, New Applications, and New Enrollments at the top of the page. Clicking the Expand icon will take you directly to the Relationship Manager to see details of these Leads.
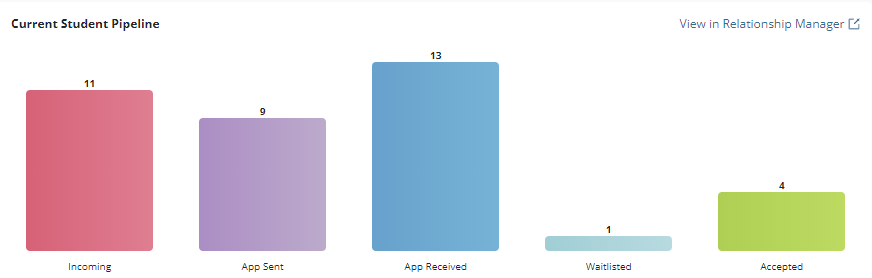
Current Student Pipeline
In the next tile, you'll see your Current Student Pipeline. This gives an overview of the total amount of Leads your school is seeing in each stage of the recruitment and enrollment process. This data corresponds directly to the Relationship Manager, and you can go directly there for more details by clicking View in Relationship Manager.
Live Parent Search
In the next tile, you will see the Live Parent Search.
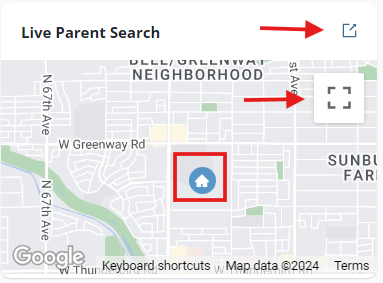
The blue house icon represents your school's location, and the purple icons represent parents actively searching for a school on the Schola website in real-time.
Click to expand to full screen on the Dashboard, or to be taken to the Live Parent Search feature with even more detail in the Student Management tab.
These purple dot parents are considered Potential Lead because they have either glanced at or looked through your school profile directly.
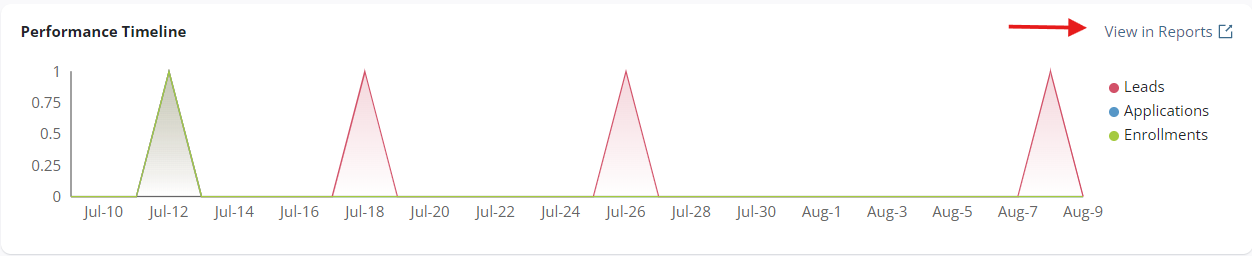
Performance Timeline
In the tile below, you will see your Performance Timeline. This is a data visualization of Leads, Application, and Enrollment trends for the timeline you select at the top of the Dashboard.
You can view more detailed data by clicking on View in Reports.
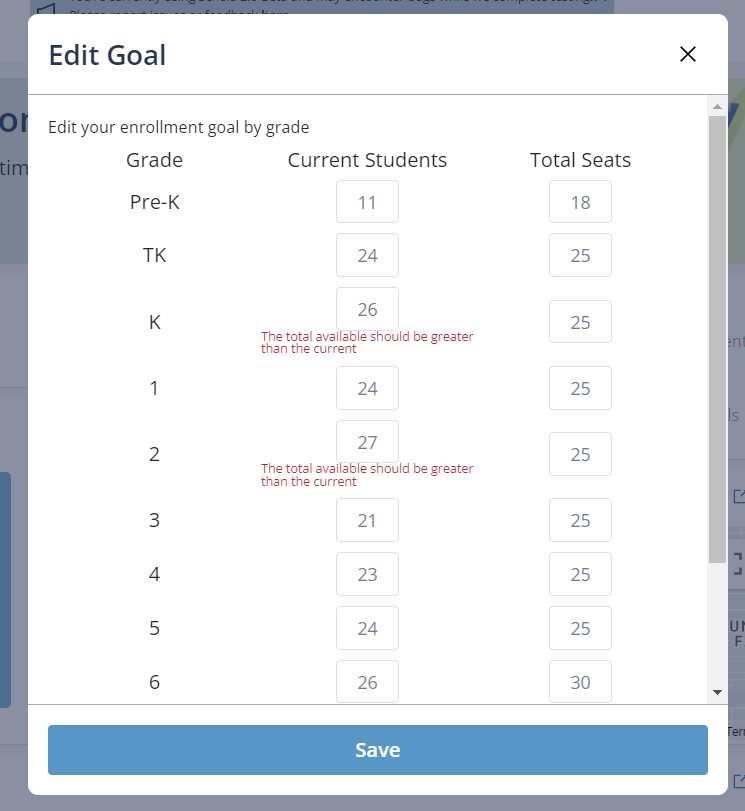
Enrollment Goals and Status
In the tile on the top right of your Dashboard, you'll have an option to add and track your enrollment goals in Schola.
Click Edit Goal, and you'll be able to fill out seat availability for all grades at your school. Updating this regularly will allow you to track progress on your Schola Dashboard!
Profile Interaction
In the next tile, you'll see information about your School Profile, including Profile Completion percentage and Appearances in the timeline selected at the top of your Dashboard.
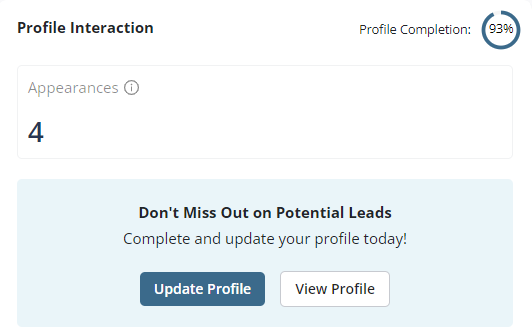
Appearances showcases the number of times your School Profile shows up in ScholaMatch results for parents searching for schools.
This emphasizes the importance of completing your School Profile and ensuring your Profile Completion percentage is 100%!
You can click on the Update Profile button to head directly to your School Profile to edit and ensure it's up to date and optimized.
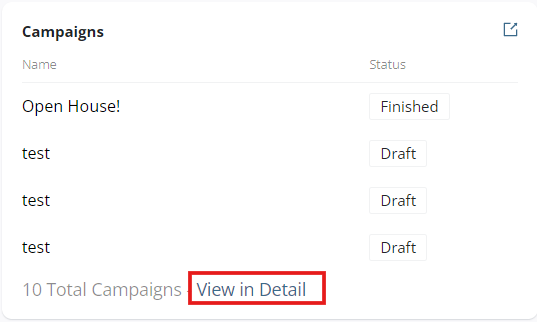
Campaigns
In the last tile, you'll see an overview of your active Campaigns. Click View in Detail to be taken directly to the Campaigns tab in the Communication Hub.
Was this article helpful?