This article will guide you through the robust reports and analytics feature of the Organization Portal in Assembly. By the end, you'll understand how to navigate and utilize this feature effectively.
Step 1: Start by navigating to the Reports page on the left side navigation.
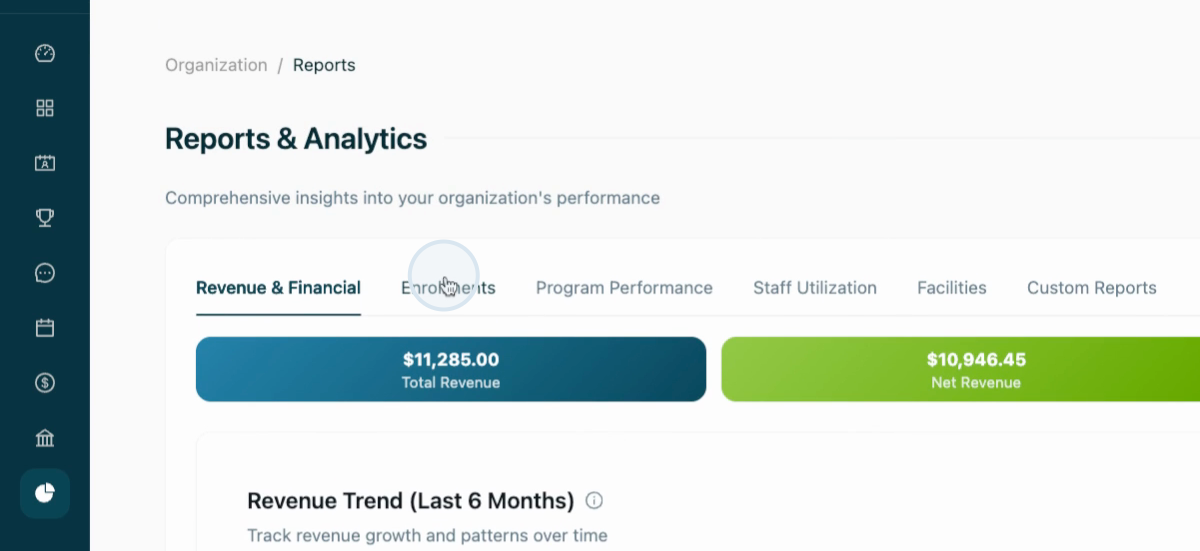
Step 2: Here, you'll find five standard reporting types: revenue and financial enrollments, program performance, staff utilization, and facilities. The last tab allows you to create custom reports by combining any series of these data points.
Step 3: In the Revenue and Financial Reports section, you'll see key metrics like total revenue, net revenue, total transactions, and average transaction. You'll also find a revenue trend line showing your revenue performance over the last six months.
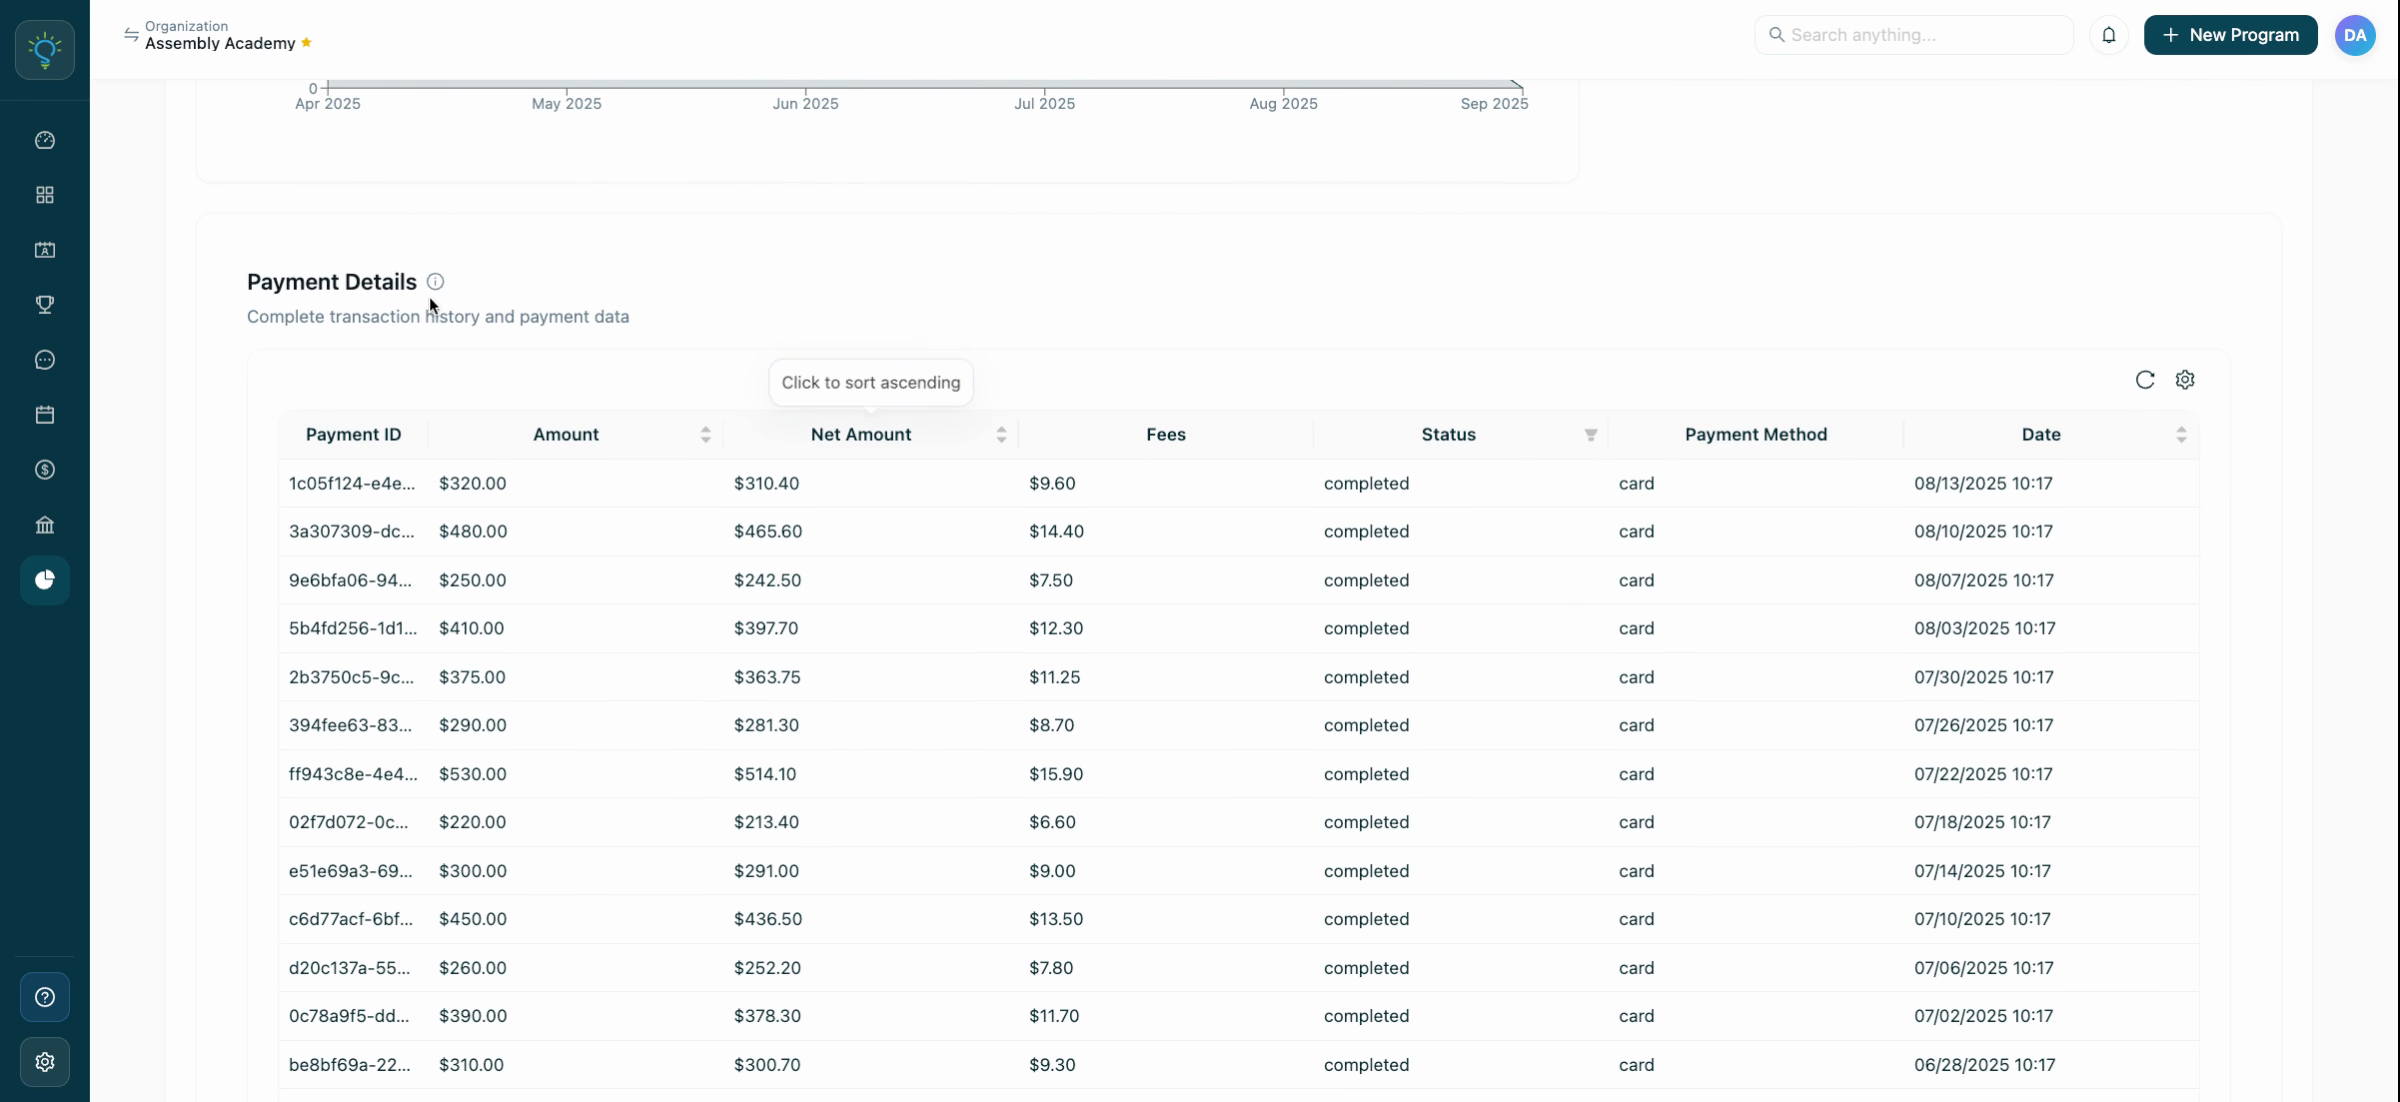
Step 4: Scroll down to view payment details for all transactions in the selected range. This includes payment method, date, status, fees, net amount, and total amount. This information helps you understand how much you've received for each transaction and how much was shared with Schola.
Step 5: Click on the Enrollments tab to view your enrollments based on specific months. You'll also see a status distribution showing the number of enrollments that are confirmed, pending payment, canceled or archived. Scroll down to see a list of all enrollees, their ages, their programs, their current status, and any payments made.
Step 6: The Program Performance tab provides a snapshot of your capacity across each program. It shows whether programs are archived or published, their categories, start and end dates, revenue, and price.
Step 7: In the Staff Utilization section, you'll see which programs your staff members are assigned to, their employment type, pay rate (if applicable), and the number of assignments.
Step 8: The Facilities tab shows which facilities are currently in use or available, and the potential monthly revenue for each facility based on an hourly rate.
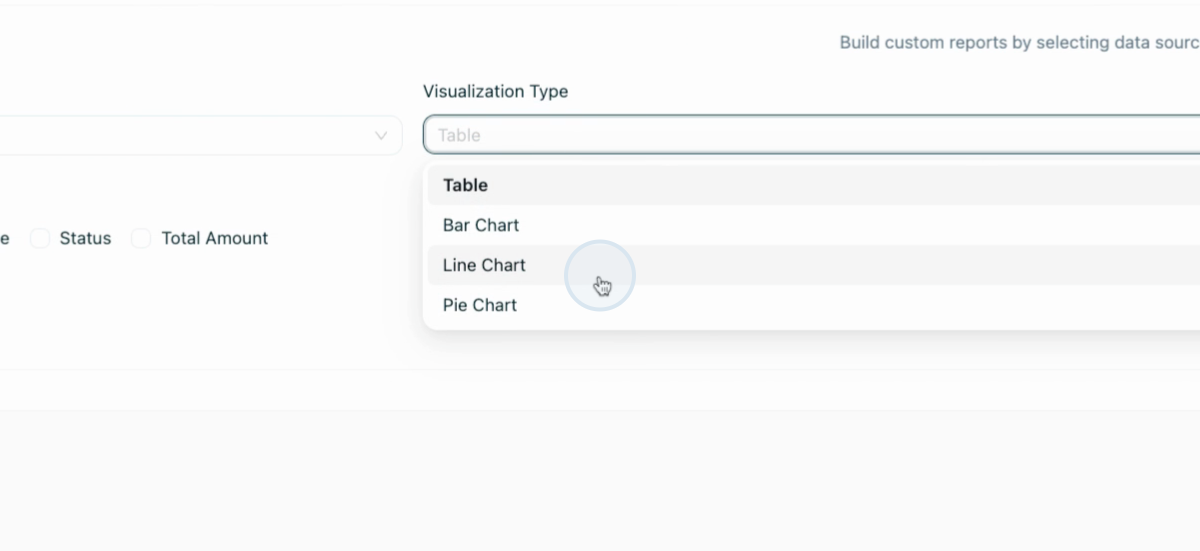
Step 9: Finally, the Custom Reports section allows you to create tailored reports. You can choose the visualization style for your report.
Step 10: For example, you might choose a line chart and select to view participant first name, last name, and total age.
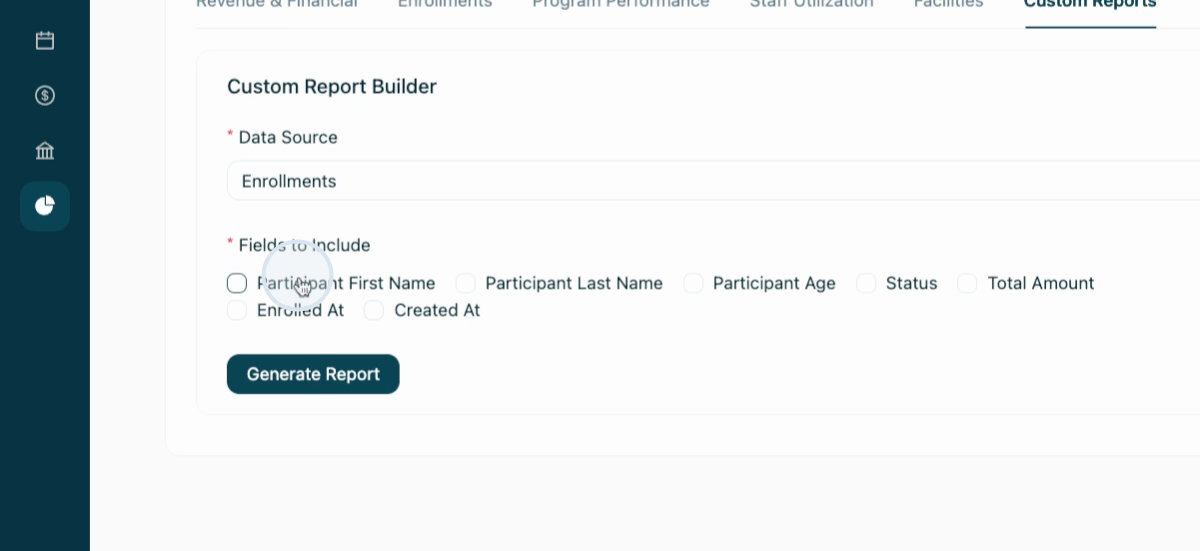
Step 11: Click Generate Report to view your custom report. If the chosen visualization doesn't suit your data, you can adjust it accordingly. You can export reports by selecting the Export CSV button.
By following these steps, you'll be able to effectively use the reports and analytics feature to gain valuable insights into your organization's operations.